GUIPlot
Version 3.4
See what was added in the latest version, available for Windows 9X/NT/2000
Screen
Images
See what a GUIPlot
window looks like and how you can interact with your data
Features
Highlights of GUIPlot's
unique capabilities
Download
Download fully functional
Demo version or free upgrades
Order Information
Please use the contact
page to request information.
Autoget
Downloads data for automated
analysis.
About
SynapseSystems
Who we are, where we came
from and where we're headed
![]()
GUIPlot
Version 3.4
Interactive Graphical Data Analysis For Windows
GUIPlot extracts numerical data from text files and produces X-Y plots and histograms with simple statistics.
- Zoom, measure deltas, exclude outliers and identify points with the mouse
- Load data files directly from the internet or your intranet for graphical display
- Set automatic update intervals that approach real time data display
- Filter or sample files during load to help manage large files and plot just the data you need
- Copy a plot to the clipboard and paste it into a word processor or drawing program
- Load text files with any non-numeric characters as field delimiters
- Paste data that was copied from your spreadsheet or other Windows application
- Store plot setup parameters and associate them with file types
- Store plot objects that execute a system command that can update a data file (or download it using Autoget) before loading it for plotting
- Drag and drop files on existing plots to add data to them or create new graphs
- Switch between X-Y and histogram modes, show/hide regression lines or statistics, all with a single keystroke
- No scripting language to learn - just point and click
GUIPlot
is oriented toward quick, easy analysis of numerical data
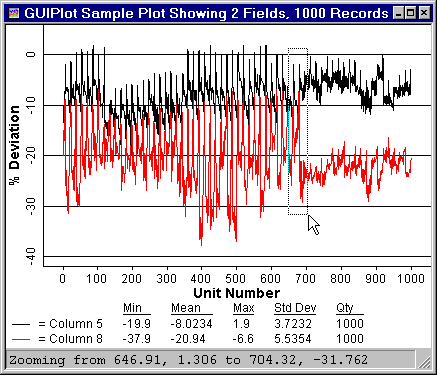
embedded in text files. The plot below was created by
dragging and dropping a file on GUIPlot,
typing the 2-character formula for the black lines
("C5") and another for the red lines
("C8"). The data was immediately plotted. The
axis labels, scale mark frequency numbers, and a title
were entered to spiff it up for this web page.

Something changed in this data around unit 680. To look more closely, GUIPlot lets you zoom in, as shown by the cursor and box being drawn on this plot. The status bar quantifies the region which will show up on the zoom plot, shown below.

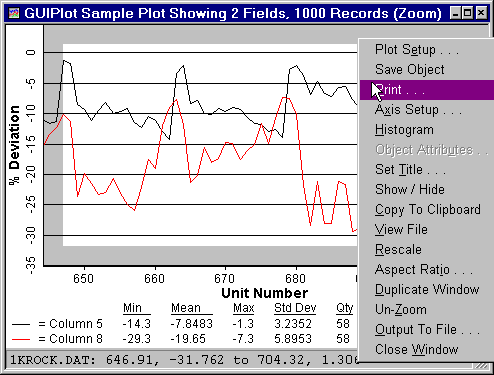
This image shows the zoom region, expanding the detail at the data's transition point. The zoom region can be nudged around with the arrow keys and moved and resized with the mouse. The menu at the right is the plot popup menu that is invoked with the right mouse button. This image shows some of the operations that can be performed on a plot. Most of these operations can be invoked by pressing a single key on the keyboard, indicated by the underlined character on the menu item. The plot window has no menu at the top to conserve space.
Take a look at some more screen images of GUIPlot's output or read more about its features. Then download and try the fully functional Demo version.
For ordering information, please inquire via our contact page .
Be sure to see the Autoget page for a program that can work alone or with GUIPlot to download files using HTTP or FTP protocols at programmed times or on demand.
- Contact SynapseSystems
- Contact Form